01 — PPV
Vibration monitoring
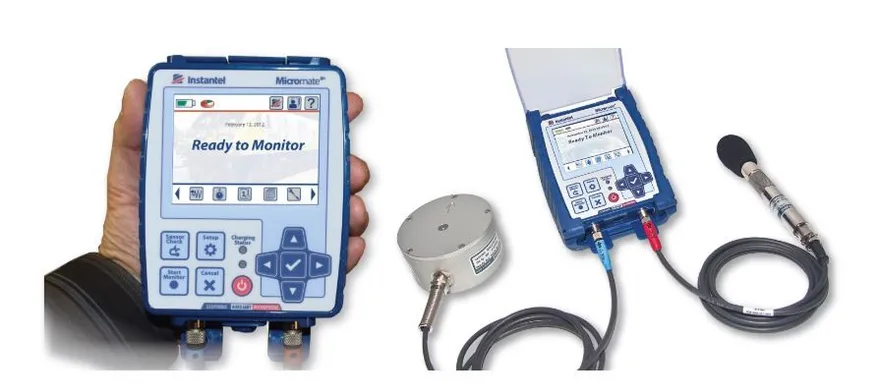
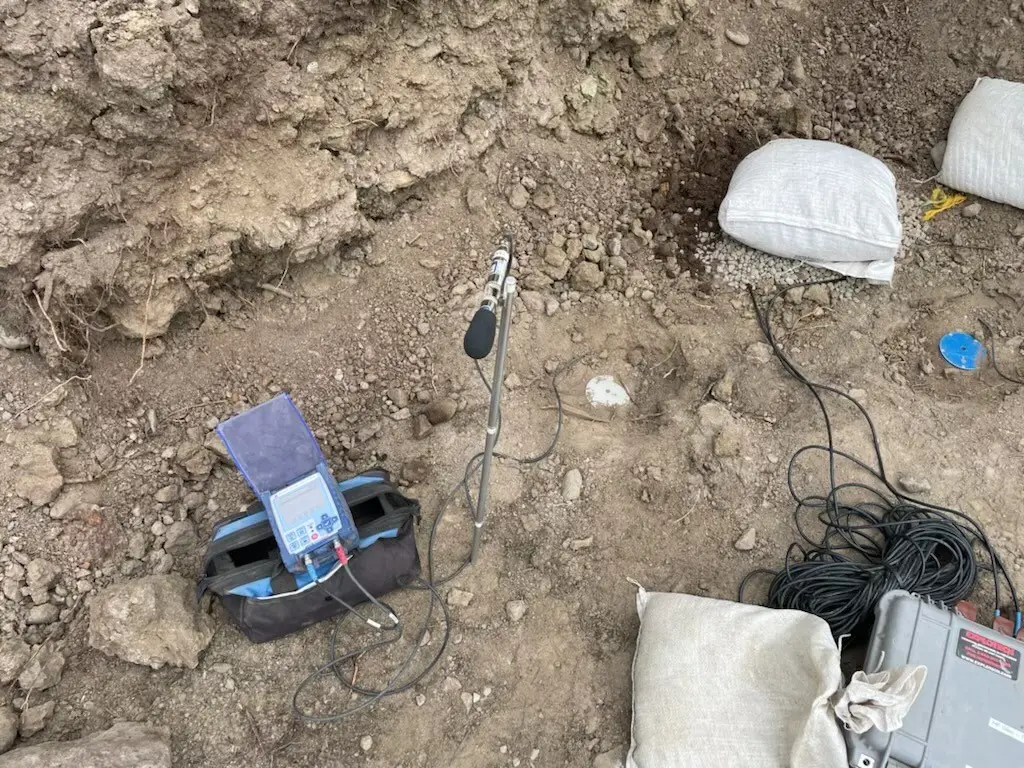
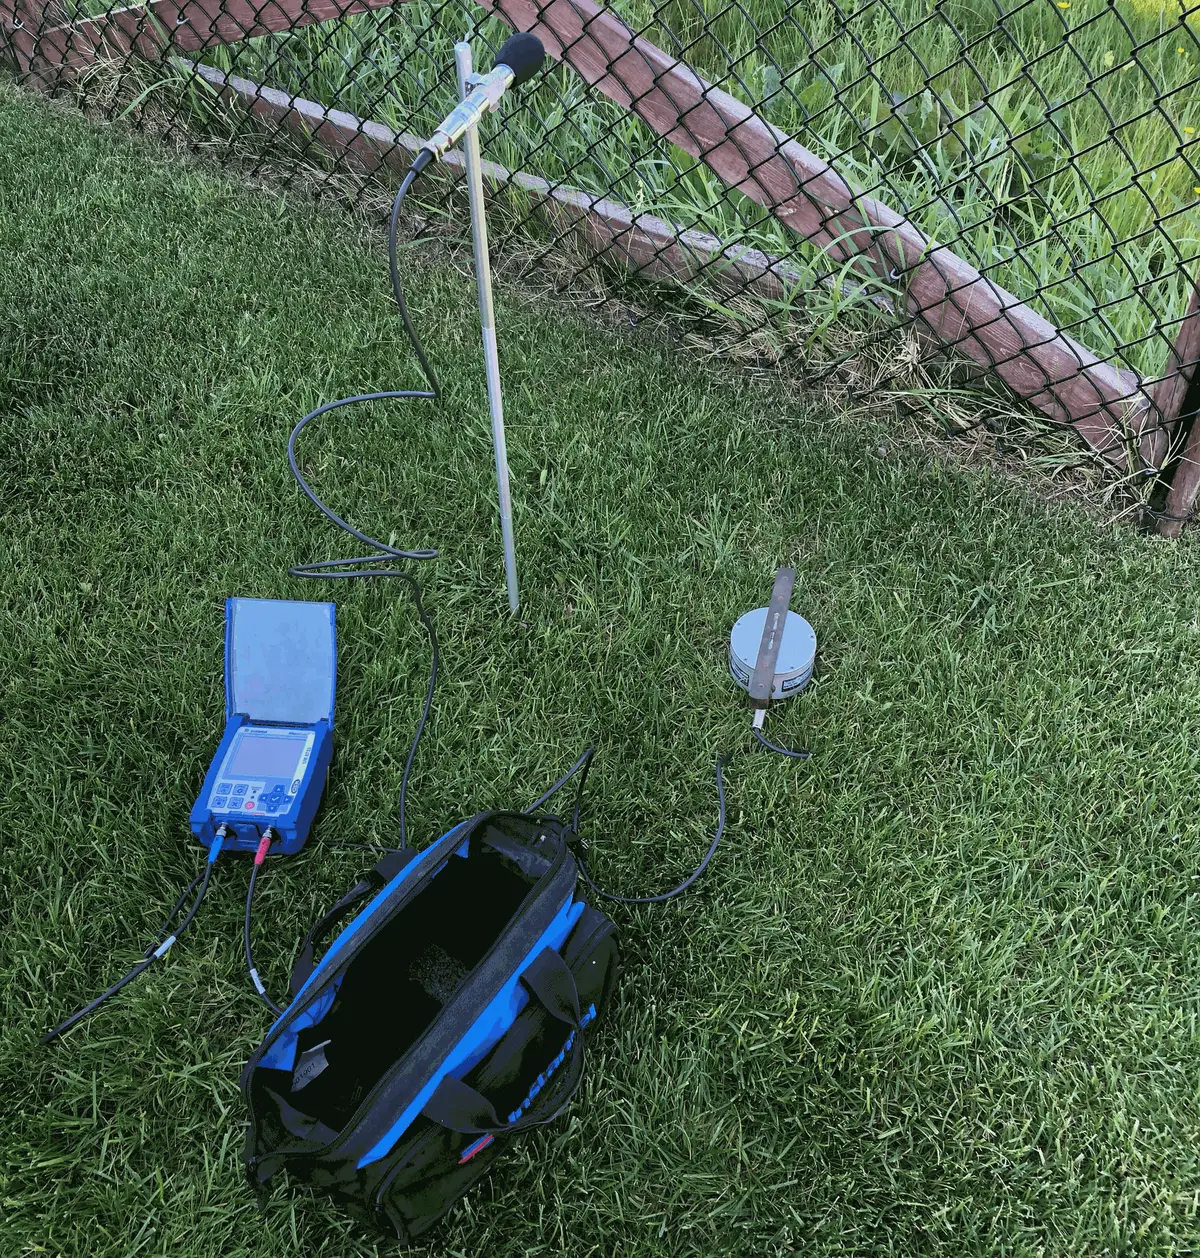
Peak Particle Velocity monitoring for quarry blasts, pipeline construction and construction sites.
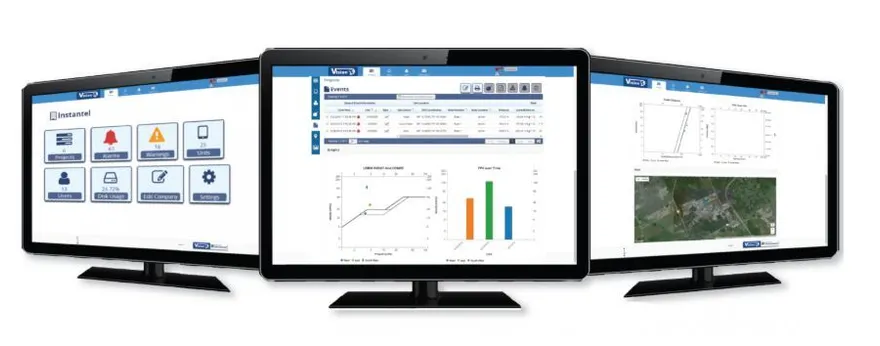
PPV monitoring for quarry blasts, pipelines and construction. Induced seismicity monitoring for fracking and wastewater injection. Seismic arrays for natural earthquakes.
Vibration and seismic monitoring for blasting, construction and energy projects.
Schematic — not to scale
Peak Particle Velocity monitoring for quarry blasts, pipeline construction and construction sites.
Monitoring of seismicity induced by hydraulic fracturing and wastewater injection.
Seismic arrays recording natural seismicity.
Examples of the work: vibration limits on construction and traffic sites, induced events around wells, regional earthquakes and early warning.
| PPV mm/s | PPV in/s | Human reaction |
|---|---|---|
| 0 – 0.15 | 0 – 0.006 | Not noticeable |
| 0.15 – 0.3 | 0.006 – 0.012 | May begin to notice |
| 0.3 – 0.9 | 0.012 – 0.035 | Just noticeable |
| 0.9 – 2 | 0.035 – 0.08 | Easily noticeable |
| 2 – 2.5 | 0.08 – 0.1 | Readily noticeable |
| 2.5 | 0.1 | Continued vibrations at this level may begin to annoy |
| 5 | 0.2 | Vibrations can be felt and become an annoyance to people in buildings |
| 10 – 15 | 0.4 – 0.6 | Continuous vibrations become unpleasant |
Humans tend to be sensitive to particle velocities in the range of 8–80 Hz. Ground-borne traffic vibrations typically occur in the range of 5–25 Hz.
Scale and table: City of Calgary Roads, “What are Traffic Vibrations”
| ID | Time | Location / depth | Mag. | Mech. |
|---|---|---|---|---|
| 2015-11-11 | ||||
| 245 | 05:25:34 | 49.45, -103.75 1,436 m deep | ML 0.46 | |
| 244 | 03:12:46 | 49.41, -103.76 1,520 m deep | ML 2.1 | |
| 2015-11-10 | ||||
| 243 | 22:11:54 | 49.46, -103.72 1,467 m deep | ML 0.21 | |
| 242 | 16:23:15 | 49.41, -103.73 1,502 m deep | ML 1.1 | |
| 241 | 11:34:31 | 49.45, -103.74 1,482 m deep | ML 0.4 | |
| Station | Code | Location / elevation | Status |
|---|---|---|---|
| WB 1 | 6N95 | 49.45, -103.76 452 m elev. | Live |
| WB 2 | 6N92 | 49.52, -103.76 433 m elev. | Live |
| Station | Stream | Trigger | Declared |
|---|---|---|---|
| 34070-6T90 | 6T90ZG | 20:20:29 | 20:20:34 |
| 34070-6T86 | 6T86ZG | 20:20:28 | 20:20:33 |
| 34070-6T86 | 6T86ZG | 20:20:29 | 20:20:34 |
| 35060-6U18 | 6U18ZG | 20:20:32 | 20:20:37 |
| 35060-6U18 | 6U18ZG | 20:20:33 | 20:20:38 |
| 34070-6T87 | 6T87ZG | 20:20:30 | 20:20:35 |
| 34070-6T87 | 6T87ZG | 20:20:31 | 20:20:36 |
| 34070-6T94 | 6T94ZG | 20:20:28 | 20:20:34 |
Tap the diagram to open it full screen

Tell us about the site and what needs monitoring.